


Have you ever wondered how your local community stacks up when it comes to diversity in ethnicities, income levels, language spoken or education attainments?
Residents of Canada’s six largest metropolitan areasĚýcan now check that out through a website launched on Monday that tracks the transformation of the country by immigration down to the neighbourhood level.
Coined “Superdiversity,” the project crunchesĚý that showcase Canada’s changing landscapes and how socioeconomic indicators such as wealth, income, employment status and education play out across ethnic groups, generations of newcomers and neighbourhoods.
“We’re hoping to just help anyone come to a better understanding of the society that surrounds them that they’re part of,” said University of British Columbia professor emeritus Daniel Hiebert, a co-founder of the project.
“This is really about social change and the abilityĚýto show it based on data.”
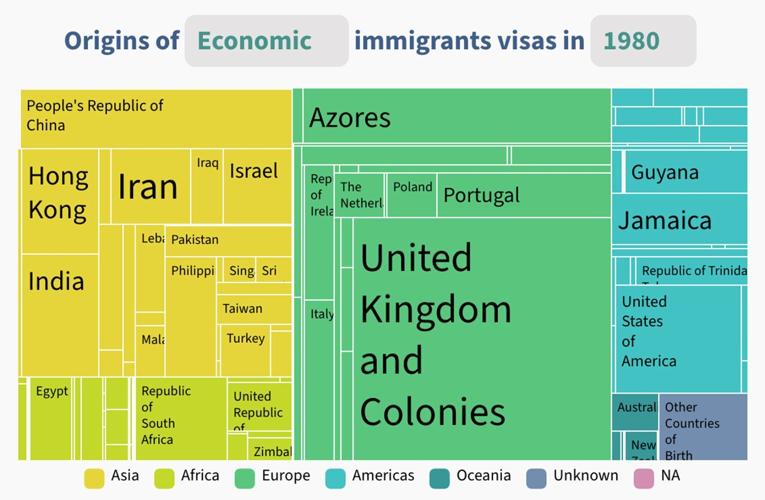
Since Ottawa changed its immigration rules in the 1960s that favoured immigrants from the U.K., continental Europe and the U.S., Canada’s population has become increasingly diverse. The proportion of newcomers from the “traditional” source countries has dwindled to about 15 per cent from nearly 90 per cent.


The Superdiversity website shows how the annual admissions of permanent residents — broken down into economic, family and humanitarian classes — evolved from under 150,000 in 1980 to over 450,000 in 2023, as well as how the nationalities of each subgroup of newcomers changed over time to now being dominated by those from India, China and the Philippines.
It also documents how the annual inflow of temporary residents — divided into asylum seekers, international students and different types of work permit holders — skyrocketed in just a few years from under 200,000 to more than 1.6 million today, and how the source countries shifted under each category.
“When you see people who came from a particular country with a particular migration stream, with a particular age group and with a different gender pattern, you can see how these fit together to produce certain social outcomes,” said project co-founder Steven Vertovec, director of the Max Planck Institute for the Study of Religious and Ethnic Diversity in Germany.
“By treating groups only as ethnic communities, we didn’t see the complexities and diversity within groups. You just treated all Indians as the same, all Italians and all Asians as the same.”
Vertovec said multicultural thinking can mask the diversity in education, health care and different social needs among people within the same ethnic group that might have come in different waves and under different circumstances.
“Multiculturalism treats them as if they all came on the same boat and that’s not the case,” he said. “We’re trying to help people see those complexities within groups.”
The visuals on the website, an upgrade from a rudimentary edition with dated data, also home in on Canada’s six largest cities:ĚýÉ«É«Ŕ˛, Montreal, Vancouver, Calgary, Edmonton and Ottawa-Gatineau.
Today, about a quarter of Canada’s population was born outside the country. The religious backgrounds of newcomers have shifted dramatically from Christianity to Hinduism, Sikhism and Islam.
Hiebert said there are more than 6,000 combinations of ethnicity and religion in metropolitan É«É«Ŕ˛, and Muslims alone come from more than 100 ethnicities.Ěý


A look at where economic immigrants came from four decades ago shows a stark contrast with today.
Superdiversity dashboard“So it’s a really different set of origins and also very different set of religions coming out the other end,” he said. “Whenever government wants to create a committee to advise them on something, they want representative folks, right? So how do you choose a representative person when you’re dealing with this kind of complexity of society?”
One interactive graphic shows how Indigenous people, Canadians overall, multiple generations of permanent residents and those with temporary status fared in terms of home ownership, incomes, employment status and education levels by ethnicity, allowing comparison.
For instance, about 60 per cent of recent Chinese immigrants (who came between 2016 and 2021) are university-educated, as opposed to about 40 per cent among those from the Philippines. However, the Chinese have a much lower rate of labour market participation and higher rate of low-income population than the Filipinos, who lag way behind on home ownership.
“It opens questions,” said Hiebert. “You begin to think, ‘Well, why is that the case?’ ”ĚýĚý
One map on the website depicts the location of immigrant groups, including the largest minority groups and recent arrivals, as well as high- and low-income areas of the city, and a few other relevant social status indicators.
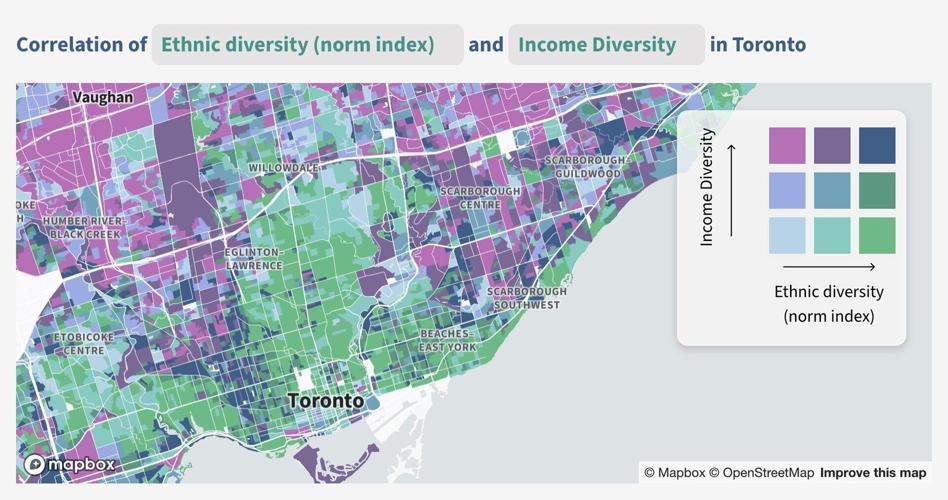
Another looks at how the degree of ethnic diversity, socio-economic status, immigration generation, admission category, income and education intersect in neighbourhoods, indicating the level of mingling of people from different ethnic and socioeconomic backgrounds.
“It’s kind of a mental exercise to think what’s going on in each of these different areas,” said Hiebert. “Why are some more versus less diverse? We also give the ability to look at other forms of diversity, like income diversity, where we see the mixing of rich and poor.”
Many neighbourhoods that show a mix of incomes and ethnic diversity, for example, can be found in areas bounded by Queen Street West to the south, Lawrence Avenue West to the north, Bathurst Street to the east and Scarlett Road to the west. It contrasts with neighbourhoods such as Pine Grove and Elder Mill in Vaughan, where the map shows less income and ethnic diversity.
“Complexity can be a way of seeing and getting a better grip on the world around you without being daunted,” said Vertovec, warning against populists who imply threats through oversimplified perspectives of the world.
“If we can help people see complexity, they can see through these kinds of reductive, populist ways of talking about immigration and ethnicity. There’s actually a lot more going on here. It’s not just that this group is coming in and taking away our jobs. It’s not all as the threat narratives portray it.”


To join the conversation set a first and last name in your user profile.
Sign in or register for free to join the Conversation